Is the mix ready? Loudness, true peak and phase for where it’s going
What integrated loudness, true peak, PLR and correlation tell you, the common references for streaming and broadcast, and how to read them before you deliver.
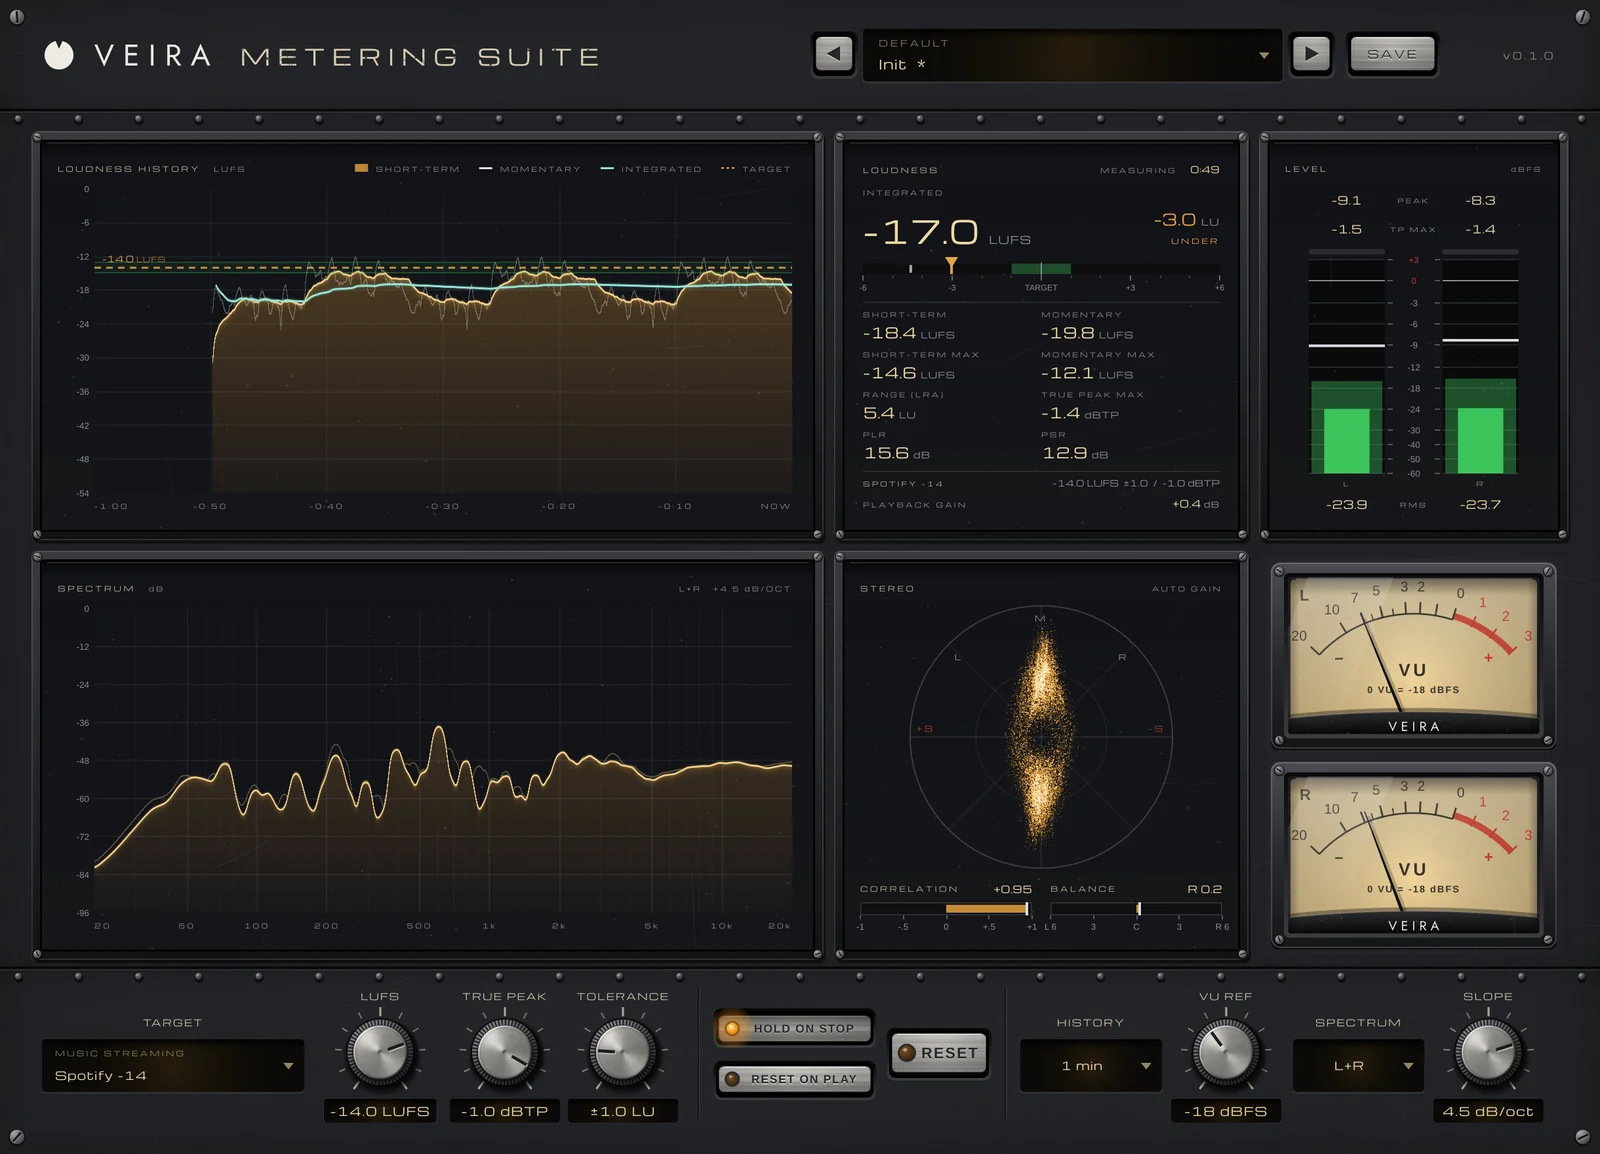
The mix sounds right in your room. The next question is how it will arrive. Streaming services turn loud songs down to a reference level, broadcasters reject programs that miss their spec, and plenty of people still hear music on a single speaker. Meters can’t tell you whether a mix is good, but they can tell you what the destination will do to it, and that’s worth knowing before you send it.
Integrated loudness: what normalization will do
Integrated loudness, in LUFS, is the average loudness of a whole program, weighted to match how we hear. Most streaming services normalize playback, turning louder masters down so songs play at a similar level; around −14 LUFS is a common streaming reference. Broadcast uses its own figures, such as −23 LUFS under EBU R 128 in Europe and −24 LKFS under ATSC A/85 in the US. A master 4 LU over the reference is usually just played about 4 dB quieter: the loudness you bought with limiting is given back, but the flattened dynamics stay. Measure the whole song, start to finish.
True peak: leave room for the converter and the codec
A sample-peak meter can read below 0 dBFS while the waveform rebuilt between the samples goes over. Lossy encoding can add a little more on top. A true-peak meter oversamples to catch those overs. About −1 dBTP is a common ceiling for streaming, and very loud masters often get more room, such as −2 dBTP. Delivery specs state their own limit, so check it.
Dynamics: PLR, PSR and loudness range
PLR, the peak-to-loudness ratio, is the true peak minus the integrated loudness; PSR compares the peak with the short-term loudness. Small numbers mean the mix is heavily limited. Loudness range (LRA) tells you how much the loudness moves over the program, in LU. There’s no right number for any of them, but they’re useful for comparing your mix with references in the same style.
- Integrated loudness: close to the destination’s reference, or below it on purpose.
- True peak: under the destination’s limit, often −1 dBTP for streaming.
- PLR and PSR: compared with reference tracks in the genre, not with a fixed number.
- Correlation: mostly positive, so nothing important cancels in mono.
- Spectrum: the low end and the top roughly in line with your references.
Phase and balance: will it survive mono?
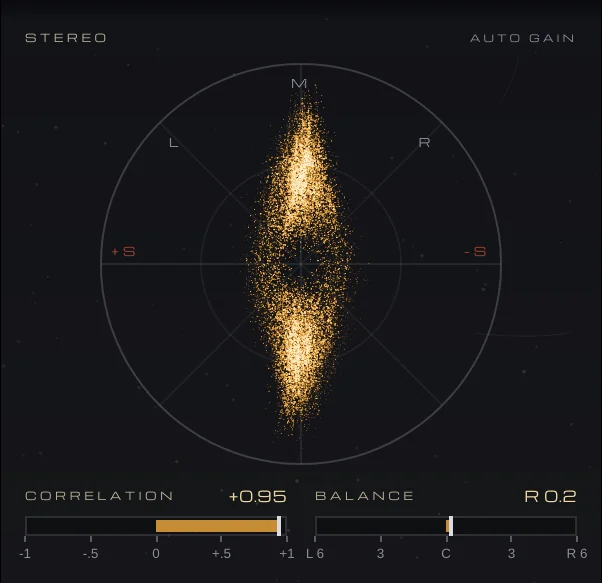
A correlation meter reads +1 for mono, 0 for unrelated left and right, and below 0 for out of phase. Short dips on wide reverbs are normal; long stretches below zero mean parts of the mix will cancel on a mono speaker. A balance reading that leans more than a fraction of a dB to one side is often a panning or level mistake worth a second look.
Doing it with VEIRA METERING
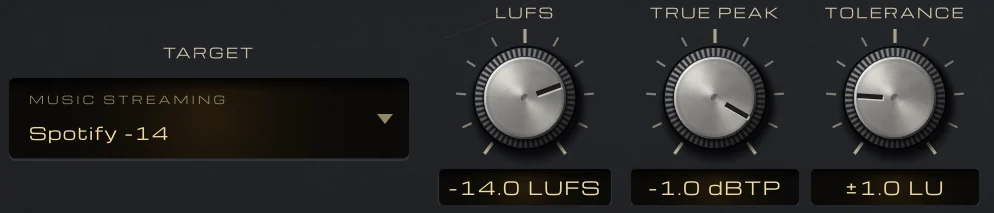
VEIRA Metering Suite measures your mix against the destination you choose. TARGET is a menu of 19 standards grouped by destination: streaming services, broadcast standards such as EBU R 128 and ATSC A/85, podcasts and games. Choosing one sets its loudness, true-peak limit and tolerance; turn LUFS, TRUE PEAK or TOLERANCE yourself and the target becomes Custom.
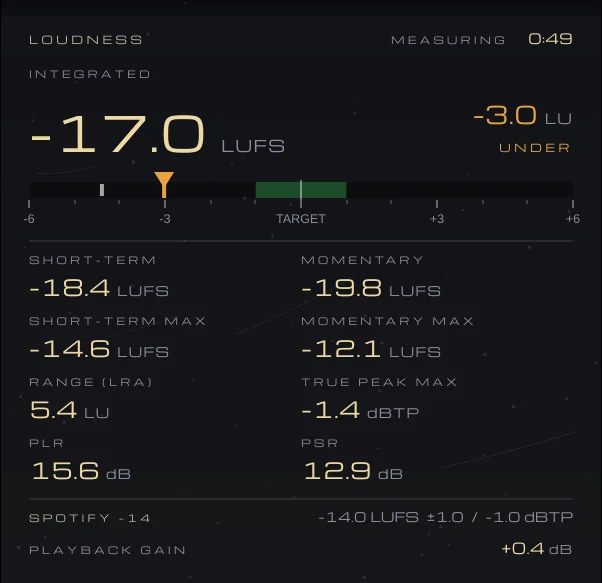
The integrated loudness shows how far you are from the target in LU and whether that’s ON TARGET, OVER or UNDER, beside short-term, momentary, range, true-peak max, PLR and PSR. For a streaming service the panel shows the PLAYBACK GAIN it would apply to your master; for a delivery spec, whether it PASSES or why not. LOUDNESS HISTORY draws the short-term loudness as a filled curve, red where it rises above the tolerance, over the last 30 s up to 60 minutes.
True peak is measured with 8x oversampling, and TP MAX turns red when it passes the limit. The vectorscope, CORRELATION and BALANCE cover the stereo checks, and the spectrum’s SLOPE tilts it so a balanced mix reads about flat at 4.5 dB per octave. With HOLD ON STOP, playing a song in parts adds up to one measurement. It changes nothing in the sound: the output is the input, bit for bit.